Am I Happy or Not? The Problems of Measuring Happiness
A closer look at the World Happiness Report's own data exposes deep problems in how happiness is measured — and raises the question of what the rankings are really capturing.
Last updated 24 September 2026
The World Happiness Report: A Starting Point
Since 2012, the World Happiness Report has done more than any comparable research initiative to establish happiness — or more precisely, life satisfaction — as a legitimate and measurable policy objective. Its annual rankings attract enormous media attention, and the underlying research has shifted political discourse in ways that purely economic metrics never managed. The ambition is correct: if we accept that the purpose of policy is human flourishing rather than the mere accumulation of output, we need measures of flourishing, and we need to understand what produces it. It has been an achievement to celebrate.
The WHR’s empirical foundation is the Gallup World Poll, which surveys nationally representative samples in over 150 countries annually. The central measure is the Cantril Self-Anchoring Scale, in which respondents are asked to imagine a ladder with the best possible life at the top (10) and the worst at the bottom (0), and to indicate where their own life currently stands. This produces a continuous “ladder score” typically averaging between 4 and 8 across the world’s nations. The WHR then uses ordinary least squares regression to explain these scores using six factors: log of GDP per capita, social support, healthy life expectancy, freedom to make life choices, generosity, and perceptions of corruption. Combined with year fixed effects, these six factors account for around 76 per cent of cross-national variation in happiness — an impressive result for any social science regression.
So far, so good.
For this essay, I set out to ask whether the data could tell us more. Pursuing that question lead, unfortunately, to conclusions that are considerably less comfortable than the WHR’s confident annual rankings suggest. This essay describes the problems I encountered in probing the data, and my thoughts on where it leaves any honest enquiry into the state of happiness around the world.
If We Accept the Framework: The Case for Three Factors
Before arriving at the deeper measurement concerns, it is worth noting that the WHR framework can be substantially simplified without significant loss of explanatory power. Replicating the WHR’s approach on a reconstructed panel dataset, I found that three factors — log of GDP per capita, social support, and freedom to make life choices — capture approximately 98 per cent of the explanatory power of all six. A three-factor model achieves an R-squared of 0.747, compared to the WHR’s 0.762. Three variables achieve nearly the same result as six.
The three factors omitted from the simplified model — healthy life expectancy, generosity, and perceptions of corruption — are statistically significant individually but largely redundant once income, social connection, and freedom are included. Life expectancy correlates strongly with GDP per capita; its independent contribution is mostly absorbed by the income measure. Generosity and corruption capture real social phenomena, but both are substantially downstream of the cultural and institutional forces that also shape social support and freedom. The WHR’s own analysis shows that generosity is not statistically significant in the most recent data update, and the three-factor model has essentially no fixed year effects, a result that suggests it is more explanatorily pure than the WHR approach. The three-factor model is not simply a truncated version of the WHR model; it is, arguably, a more honest account of what is actually doing the explanatory work.
The three factors that survive are not arbitrary. They correspond to three fundamental dimensions of human experience that philosophical traditions across cultures have independently identified as foundations of flourishing: the material dimension (income removing existential insecurity and expanding the scope of the possible), the social dimension (belonging, reliable connection, and the knowledge that one is not alone), and the agentive dimension (the capacity to author one’s own life, to make choices that express one’s values). These connections to Aristotelian eudaimonia, to Amartya Sen’s capability approach, and to contemporary positive psychology are not accidental. They suggest that the WHR has, through empirical selection, converged on something philosophically real. The additional three factors are, in the strict sense, redundant.
However, even this simplified model carries significant measurement problems that compound at every step. The remainder of this essay examines those problems.
An Alternative Architecture: Cultural Heritage and Structural Variables
A question that animates the entirety of this project is the extent to which national cultures play a role, either directly or indirectly, in happiness. Interrogating the survey data through this lens, it became apparent that there was a prima facie tendency for the social connections and freedom scores to cluster around geographic groupings.
I was also concerned about the extent to which my three-factor version of the WHR’s explanatory approach is built almost entirely on survey responses — the dependent variable, happiness, and two of the three independent variables, social connections and freedom, are from the Gallup world poll.
This gave rise to an alternative approach to the explanatory variables that sought to avoid dependence on survey results by classifying countries according to their cultural and historical heritage, and using those classifications alongside objective structural variables to explain happiness. The intent was to try to identify country groupings that potentially shared cultural characteristics as a means to identify what cultural characteristics might underlie the social connection and freedom survey responses.
Log of GDP per capita, which on its own has a very high correlation with happiness and is completely objective, was retained. Looking at the residual not explained by log of GDP per capita, it was apparent that country scores were likely being effected by conflict. To provide an objective measure of this, the Safety & Security sub-index of the Global Peace Index was added as an explanatory factor.
Based on the remaining residual, the 153 countries with adequate time series data were able to be classified into nine cultural-geographic groups. Northern European and Anglosphere countries (NEA), which typically sit at the top of the happiness ratings, were adopted as the reference group. The other eight groups are: Southern European Catholic, Eastern European Orthodox, Central Asian Muslim, Latin American Catholic, Arab Muslim, Sub-Saharan Africa, East Asian, and South Asian. These classifications are based on historical, religious, and geographic criteria. In a few cases, historically anomalous countries were allocated to their best cultural fit group. For instance, Israel was included in the NEA group, Nepal in East Asia, and Haiti in Sub-Saharan Africa.
A refinement was subsequently made to replace log of per Capita GDP with the cube root of Household Final Consumption Expenditure (HFCE) per capita. HFCE is a measure of actual material living standards that corrects for the factor income distortions affecting GDP in countries like Ireland and Singapore (where GDP substantially overstates resident living standards due to multinational profit flows), and for the consumption share distortions affecting high-savings economies like China (where HFCE is only around 37–38 per cent of GDP compared to a typical middle and high income country ratio of above 60%). The cube root transformation is used in preference to the logarithm because it fits the income-happiness relationship better empirically (improving the Akaike Information Criterion by 5.2 points over log GDP) while still capturing the principle of diminishing marginal returns to material welfare.
A regression was estimated using the between-groups method. This collapses the panel to country time-averages and estimates the structural cross-sectional relationship directly, avoiding the severe serial correlation that inflates apparent precision in pooled ordinary least squared (OLS) regressions. This model, that is happiness scores as explained by HFCE, Safety & Security, and cultural groupings, achieved an R-squared of 0.860, with an adjusted R-squared of 0.850. The F-statistic for the joint significance of all variables is 86.93, against a five per cent critical value of 1.91: the probability that these results are a product of chance is effectively zero. On a pooled OLS basis directly comparable to the WHR’s methodology, the equivalent R-squared is 0.782, above the WHR’s 0.762 — achieved with no subjective survey variables, and with only one year of 18 years showing any significance for year fixed effects. In other words, this alternative model generates results that are materially better than the WHR methodology.
Figure 1 shows the coefficients of the cultural groups, which are referenced to the NEA group. The coefficient represents the average difference between actual and predicted happiness that is explained by membership of the group.
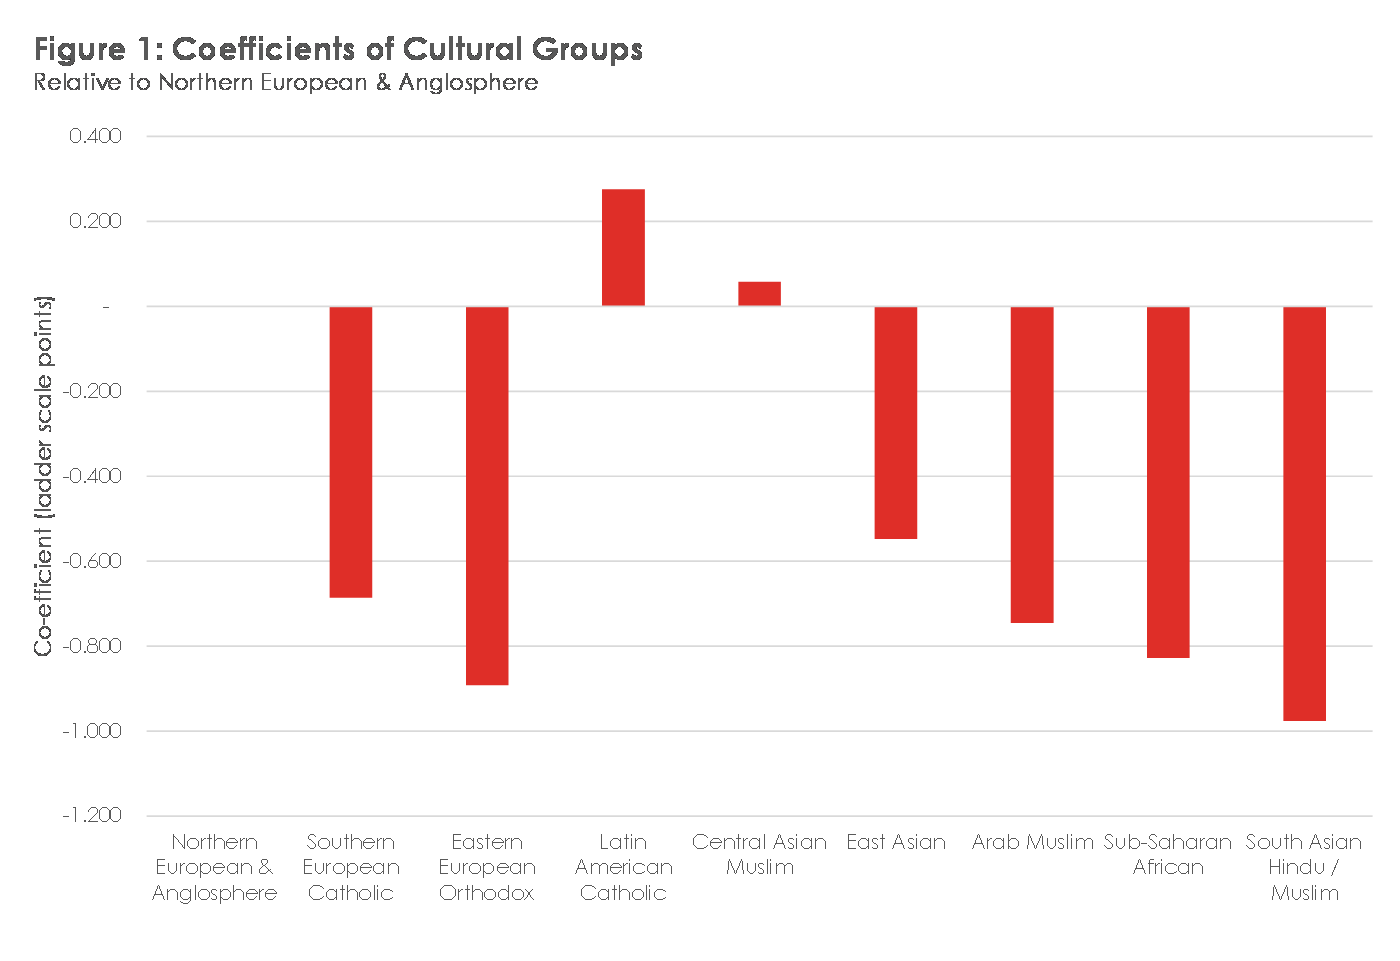
Several findings from this model deserve particular attention. Latin American Catholic countries (LAC) and Central Asian Muslim countries (CAM) are statistically indistinguishable from the NEA reference group after income and safety are controlled. These three groups have distinctly different cultures, yet have similar levels of unexplained happiness. All of the other groupings are materially less happy, for reasons not explained by income or safety, and show distinct levels of variation among themselves.
These findings ostensibly support the hypothesis that cultural inheritance is a powerful predictor of reported happiness. The question would be what those cultural factors are. Characteristics like individualism, social expectations, trust, tolerance, and social support offer rich scope for understanding how culture shapes happiness. But a fundamental ambiguity arises immediately, and it defines the rest of this essay: are these cultural groups predicting happiness itself, or are they an artefact of the happiness measurement mechanism? This is the question that the measurement literature forces us to confront.
What the Cantril Ladder Actually Measures
The Cantril ladder instructs respondents to place themselves at the step that represents where they personally stand, with the best possible life at the top and the worst at the bottom. The problem is immediately apparent: the “best possible life” is not a fixed reference point. It is whatever the respondent imagines the ceiling of possibility to look like — and that imagination is shaped by culture, by aspiration, by what one has seen, known, and dreamed of, by the moment in history one inhabits, and by interpretation of what “possible” means in their context.
This creates two distinct layers of measurement uncertainty. The first operates across cultures at a point in time: different cultural groups may define “best possible life” differently, meaning the same number on the scale represents different underlying wellbeing in different countries. The second operates within cultures over time: as living standards, global communications, and aspirations change, the meaning of a given scale position shifts, making longitudinal comparisons of reported happiness unreliable even within countries.
A useful analytical framework comes from recent work by Prati and Senik (2026)1. They formalise the difference between two competing interpretations of why reported happiness tends to remain flat despite rising incomes and improving objective conditions. In the “hedonic treadmill” interpretation, improving life circumstances raise aspirations in parallel, so that actual (latent) happiness remains flat even as objective conditions improve — people adapt to their circumstances, a process known as homeostasis, and it becomes harder to satisfy them. In the “rescaling” interpretation, improving circumstances do raise latent happiness, but people simultaneously raise their standards for what counts as a good life, applying increasingly stringent criteria when using the scale. Reported happiness therefore remains flat even though latent happiness has improved. Essentially, the first interpretation is working on the numerator, and the second on the denominator. The reported series is identical under both interpretations; the story about actual wellbeing is completely different.
Critically, Prati and Senik show that these two interpretations are observationally equivalent in standard happiness data: you cannot distinguish them from reported scores alone. They require additional information: specifically retrospective assessments that ask people to rate their past satisfaction on the current scale. Using archival data from the United States extending back to Cantril’s original 1959 surveys, they construct a corrected time series — the M-LINE — that accounts for rescaling. Their finding is striking: once rescaling is corrected for, US happiness has risen substantially over the past seventy years, roughly in parallel with GDP per capita. The Easterlin paradox — the long-observed flatness of happiness despite rising incomes, and one of the most influential findings in welfare economics — largely disappears.
This is a significant result. It suggests that the flat reported happiness trend that most happiness researchers take as a starting point may itself be a measurement artefact. The apparent stagnation of wellbeing in developed countries, which has been used to argue against conventional economic measures of progress and to support radical policy reorientations, may in reality be a consequence of the measurement methodology rather than genuine hedonic stagnation.
Rescaling in Practice: Covid and Ukraine
While response style biases corrupt cross-cultural comparisons at a point in time, rescaling corrupts comparisons within countries over time. These are distinct problems with a common root: the Cantril ladder is a bounded scale anchored to an imagined ceiling that is itself variable.
The COVID-19 pandemic provides a striking natural experiment in rescaling. Global life satisfaction time series were surprisingly flat during 2020, when more than half the world’s population was under lockdown and the texture of daily life had been severely disrupted. This flatness is paradoxical if reported scores track latent wellbeing: objective conditions had clearly worsened severely. Under the rescaling interpretation, the flatness is explained by a contraction of aspirations. When the range of imaginable “best possible lives” narrows dramatically because available options have been severely restricted, the same latent satisfaction maps to a higher reported position on the ladder. Reported happiness held steady not because people were genuinely unaffected but because the measurement standard contracted alongside their circumstances. The Prati-Senik M-LINE index, applied to available data, confirms this: correcting for rescaling reveals a substantial latent happiness decline in 2020 that the nominal series completely conceals.
Similarly, reported Ukrainian life satisfaction scores in 2023 were comparable to pre-war 2018 levels, despite the Russian invasion. The rescaling interpretation — that wartime dramatically compressed the imagined ceiling of what constitutes a good life, causing the same latent satisfaction to register at a higher reported position — is more plausible than the alternative: that Ukrainians’ actual wellbeing was genuinely unaffected by war.
These examples illustrate a general principle. Any event that shifts the aspirational ceiling — what people imagine as the best possible life — will register as a happiness change in the nominal series, regardless of whether latent wellbeing has moved at all. The time series of reported happiness is as much a measure of the dynamics of aspiration as it is a measure of the dynamics of actual wellbeing.
Response Style Bias
At any given point in time, the Cantril ladder scores of different countries are subject to systematic biases in how respondents use survey scales. The response style literature identifies five main patterns that operate independently of actual subjective states. These biases are long established, with the frequently cited Chen et al2 having described the response styles as far back as 1995.
Extreme Response Style (ERS) is the tendency to use the endpoints of a scale — 0 and 10 — regardless of the actual magnitude being assessed. Midpoint Response Style (MRS) is the opposite: a preference for central values that may understate both high and low experiences. Acquiescence Response Style (ARS) is a general tendency to agree with propositions regardless of content. Disacquiescence (DARS) is the reverse tendency. Social Desirability Response Style (SDRS) is the tendency to give answers that are socially normative or approved in one’s cultural context, which makes the response a measure of social expectation rather than of experience.
For the Cantril ladder specifically, ERS, MRS, and SDRS are the most consequential. The empirical data provides clear examples. Across multiple waves of the World Values Survey, which has some overlap with the Gallup World poll but with fully open data, Brazil for instance has consistently seen between 25 per cent and 35 per cent of respondents rate their life satisfaction at 10 out of 10. Colombia has reached over 40 per cent. These proportions are not prima facie compatible with unbiased scale use among populations experiencing significant poverty, crime, and institutional failure: they more likely reflect a cultural tendency to use the top of the scale regardless of actual life circumstances. In most Asian, European and Middle Eastern countries, the reverse pattern tends to hold: Japan and Finland as examples, have a skewed normal distribution score, even at high income levels, and highly safe and stable societies, consistent with a MRS tendency. These example distributions are shown in Figure 2.
Figure 2: World Values Survey Subjective Wellbeing Score Distributions for Selected Countries
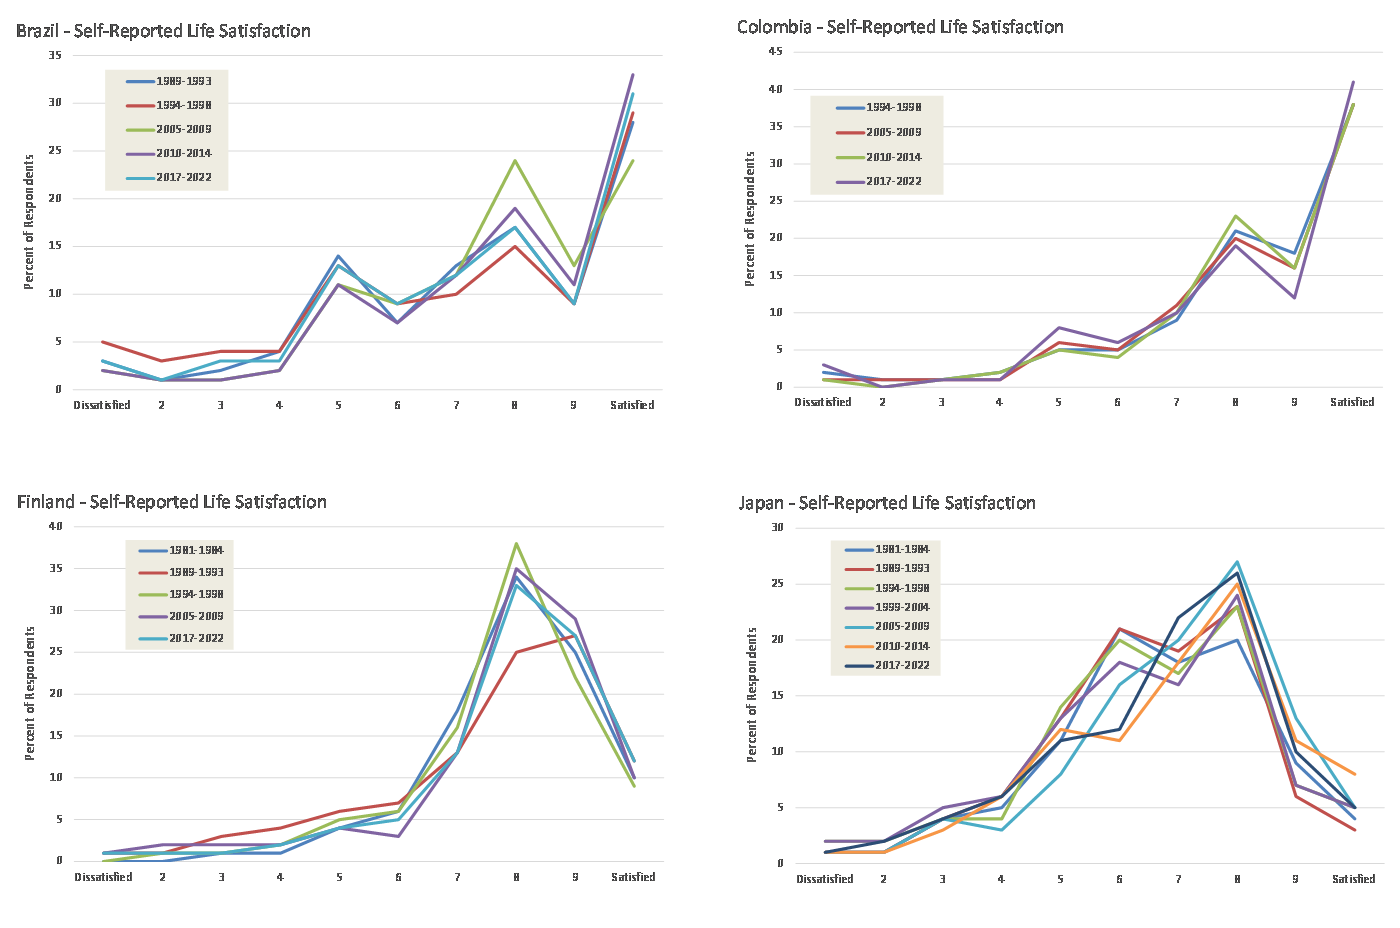
SDRS introduces a different distortion. If expressing dissatisfaction with one’s life is culturally or politically risky, survey responses will be biased upward regardless of actual sentiment. Uzbekistan and Kyrgyzstan consistently record freedom satisfaction scores above 90%, and up to 98%, despite repressive Governments and highly socially constrained cultures. It is impossible to say that this misrepresents true satisfaction, but it seems unlikely. As already noted, Central Asian countries as a group show relatively high levels of happiness. The question is whether this reflects a cultural predisposition to happiness, or SDRS.
The consequences for any analysis of happiness data are uncomfortable. If ERS systematically inflates the measured happiness of Latin American and other populations, and MRS systematically deflates European, Asian, and Middle Eastern scores, then my cultural group coefficients may be modelling the cultural architecture of response styles rather than of happiness. The LAC group’s near-NEP happiness score may reflect not genuine wellbeing parity with the Anglosphere, but a response style that biases scores upward. The EA deficit may reflect not a genuine wellbeing shortfall but a response style that biases scores downward. We cannot currently determine the relative contributions of genuine happiness and response style bias to these patterns.
This is not a comfortable conclusion. But it follows logically from the evidence. The same cultural forces that shape social organisation, family structure, and collective identity also shape how people use survey scales. Disentangling genuine wellbeing from response style requires techniques that happiness surveys do not currently employ.
The most developed approach for correcting cross-cultural response style differences is the anchoring vignette methodology, developed by King, Murray, Salomon and Tandon (2004). Rather than searching for culturally neutral stimuli — which are extraordinarily difficult to identify, as even apparently neutral stimuli such as colour preferences or visual illusions show systematic cross-cultural variation — the anchoring vignette approach describes specific concrete scenarios in the domain being measured and asks respondents to rate those scenarios on the same scale they use to rate themselves. By comparing how different cultural groups rate identical standardised scenarios, it becomes possible to estimate and correct for systematic scale-use differences. This method has been applied extensively in health surveys by the World Health Organisation, but not yet systematically to happiness data.
Despite decades of awareness of these problems in the academic literature, they have not been corrected in the major cross-national happiness datasets, possibly for practical reasons of survey cost and length, and possibly because of institutional inertia around a methodology that has become standardised. I find this troubling, and unsatisfactory.
Latin America as a Case Study in Measurement Ambiguity
Latin America provides the sharpest illustration of the measurement challenges in cross-national happiness research — a case where the same empirical finding supports multiple interpretations that current data cannot separate.
Latin American countries consistently report happiness levels close to or indistinguishable from Northern European and Anglosphere countries after controlling for income and safety, a result reaffirmed in my alternative architecture experiment. This is striking. On average, Latin American countries don’t just have materially lower incomes and higher crime rates that my analysis controls for, but higher inequality, weaker institutions, higher political instability, and more pervasive corruption than the comparison group — all factors that should be associated with lower happiness. The catholic cultural heritage that appears to negatively impact happiness in Southern Europe doesn’t appear to apply. Their near-parity in reported happiness constitutes a genuine empirical paradox.
Three explanations are in play, and all three possibly operate simultaneously, at least to some extent.
The first is genuine social richness. Mariano Rojas, whose domain satisfaction research programme is the most systematic treatment of this question, argues that Latin American culture generates an abundance of close interpersonal relations — strong extended family ties, high family satisfaction, emotional expressiveness — that produce real wellbeing through relational rather than material channels. Mexico’s national wellbeing survey (BIARE) provides concrete evidence: family satisfaction carries a coefficient in explaining satisfaction with affective life that is more than twice as large as standard of living — a pattern that appears to reverse the typical ordering seen in Northern European data. If Latin Americans evaluate “best possible life” primarily in relational rather than material terms, they may genuinely be closer to their ceiling than a material comparison would suggest. The counter-argument is that the LAC countries are not global outliers. While it is true that they are distinct from European countries on the relevant measures, they are not distinct from the broader global sample. For instance, Rojas, in a Chapter for the 2018 World Happiness Report, uses a World Values Survey question about making parents proud as a life goal to illustrate the cultural difference between Latin Americans and Western countries. The data is convincing in isolation. However, when Latin America is compared to the full population of countries surveyed for the World Values Survey, they largely sit toward the midpoint of the data set. That is, they rate the importance of making their parents proud well below that of many other countries that are not similarly outliers in regard to happiness. This would seem to be problematic for the hypothesis.
The second explanation is extreme response style. Brazil’s 29 per cent and Colombia’s 38 per cent rating their lives at 10 out of 10 are not compatible with unbiased scale use. If ERS accounts for even half a point of the Latin American average ladder score, a substantial portion of the apparent happiness premium disappears without any change in genuine wellbeing.
The third explanation is measurement non-equivalence in the best possible life anchor. If Latin Americans interpret “best possible life” primarily in relational terms — a life abundant in warm family and social connections — while Northern Europeans interpret it primarily in material and institutional terms, the two groups are rating their positions in different distributions. The number on the scale cannot be straightforwardly compared across cultures under this interpretation.
All three explanations — genuine social richness, response style inflation, and measurement non-equivalence — probably contribute. Current data cannot separate them. The honest conclusion is that we do not know whether Latin Americans are genuinely as satisfied with their lives as Finns, either because shortcomings in some areas are offset by high levels of social richness, or because they rate different aspects of life with different levels of importance, or they are simply using the scale differently. Each explanation leads to very different conclusions.
The Global Happiness Trajectory and the Smartphone Hypothesis
Given that this project leans toward a view that the world is struggling with societal discontent, I figured that, notwithstanding the growing list of reliability concerns, it would be informative to calculate population weighted happiness, that is the happiness scores of the available countries, which represent about 93% of world population, times the populations of those countries3.
What I found is that the series initially declines nearly continuously, from 5.334 in 2008 to 5.118 in 2019 — a sustained decline of 0.216 points over eleven years. However, from 2019 the trajectory reverses, with a continuous improvement in the score, which reaches 5.522 in 2025. The decline does not appear to be explained by any potential proximate cause. It overlaps to some extent with the global financial crisis, but economic recovery had occurred in most developed countries well before 2019, and the decline continued through years of reasonable global growth. A second dip could potentially be explained by Covid, but the timing doesn’t align well. There has been a notable increase in conflict, but this coincides more with the upturn in happiness, not the decline.
An alternative candidate explanation is the spread of smartphones. Recent research has started to link smartphone adoption with a range of societal changes, most prominently declining birth rates4. Global smartphone adoption followed a classic logistic growth curve: approximately 2 per cent of the adult global population in 2008, reaching approximately 80 per cent — effectively saturating the population outside young children and the elderly — by 2018–19, after which penetration is assumed to have plateaued. The period of rapid penetration growth coincides essentially exactly with the period of declining gross world happiness, as shown in Chart 2, noting that happiness is a rolling lagged three-year average.
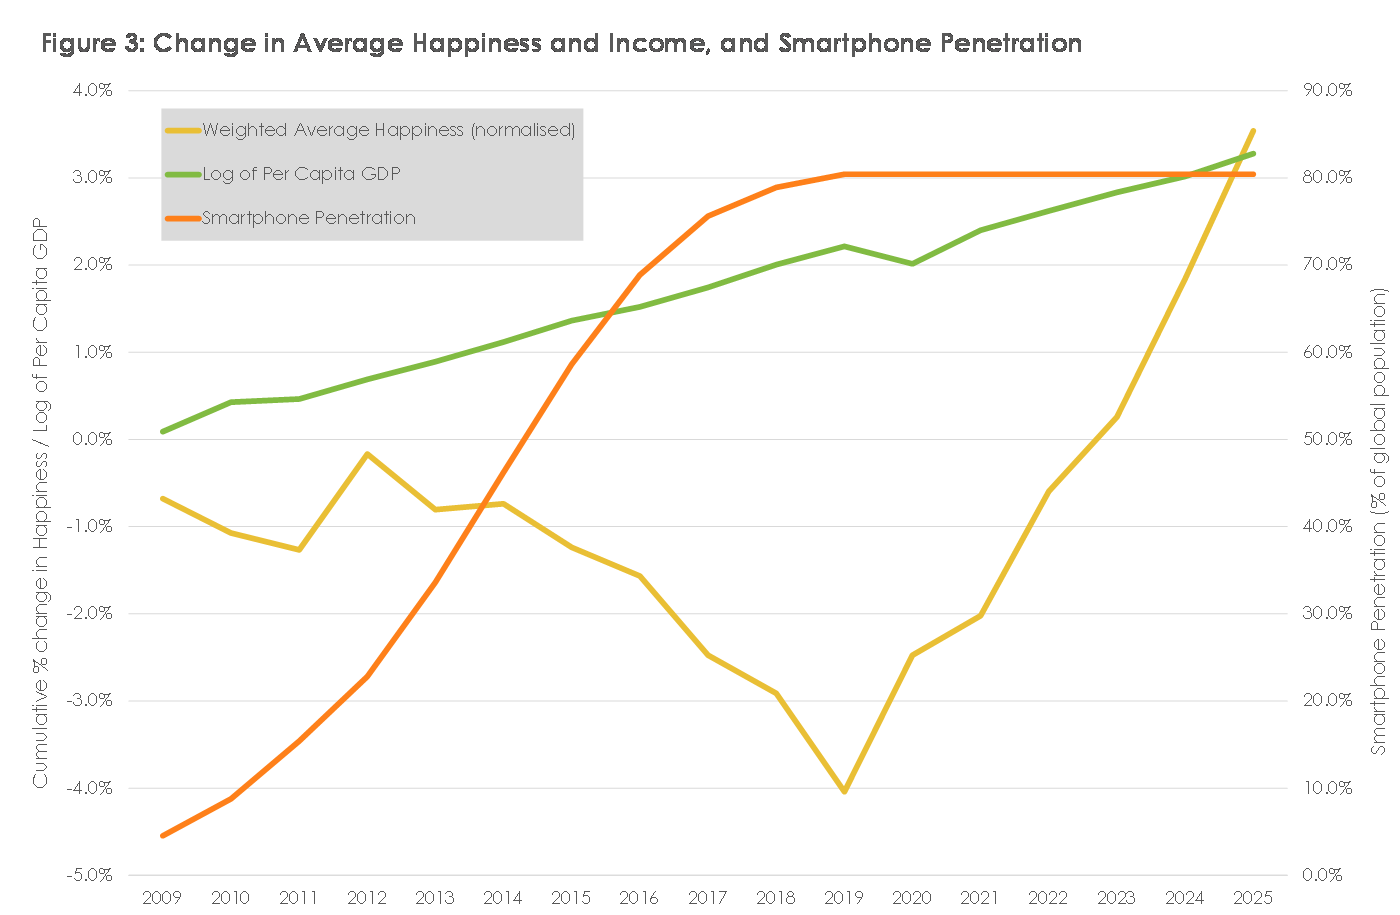
The proposed mechanism operates through the Cantril ladder’s “best possible life” anchor. Smartphones gave billions of people, for the first time, direct and continuous access to the full range of human experience globally — to the living standards, lifestyles, aspirations, and possibilities visible in every corner of the world. This may have expanded the reference distribution for “best possible life” materially and rapidly, particularly for populations in developing countries who had previously had limited visibility of what lives elsewhere looked like. Under the rescaling interpretation, this expansion of the imagined ceiling would cause reported happiness to fall even if latent wellbeing was unchanged or improving: respondents are now anchoring their scale position to a higher ceiling. The further implication is that as penetration saturated around 2018–19, the ceiling reset was complete. At this point, the happiness trend reversed, beginning a continuous upward climb, implicitly reflecting the underlying rate of wellbeing improvement.
This hypothesis cannot be definitively tested. The correction required — a globally applied M-LINE that separates genuine wellbeing trends from rescaling effects — does not yet exist, and any attempt to reconstruct one extending back to 2008 is going to have highly questionable reliability.
As such, this conjecture will remain purely that. If correct though, there are two significant consequences. First, it implies that the causal estimates in happiness research conducted using 2008–19 data are compromised: the dependent variable is subject to an external explanatory factor that has no apparent control. Second, this effect should largely disappear from 2019 or thereabouts. The prediction would be that there will be a discontinuity in the power of explanatory variables around 2019. The post 2019 dataset is likely to offer a cleaner basis for researching the causes of subjective wellbeing, though the risk is that AI will cause another pervasive, global disruption that corrupts the temporal stability of self-reported happiness.
The Missing Question: What Do People Actually Value?
There is a more basic gap underlying everything discussed above, and it deserves treatment in its own right rather than as an adjunct to anchoring methodology. In decades of cross-national happiness research, respondents have been asked, exhaustively, to rate their satisfaction. They have almost never been asked, directly, what they value — what actually constitutes a good life in their own estimation. The World Values Survey, for all its extensive interrogation of moral and political attitudes, does not ask this question in any systematic way. Neither does the Gallup World Poll. The entire edifice of cross-national happiness measurement rests on an unstated assumption about what “best possible life” means to the person doing the rating, and no one appears to have simply asked.
This is a strange omission on its own terms. Happiness research is, definitionally, survey research — it already accepts self-report as its evidentiary base. Asking people to declare what they value is a smaller epistemic leap than asking them to rate their satisfaction on an undefined scale, and it would supply information needed to interpret the scale ratings already being collected. Declared preferences are, of course, a weaker form of evidence than revealed preferences inferred from behaviour: people are not always accurate or honest about what actually drives their satisfaction, and stated importance can diverge from lived weighting. But weaker evidence is not the same as no evidence, and at present there is effectively none. A reasonably designed declared-preference module would be a legitimate starting point for identifying candidate explanatory domains, even if its outputs eventually need to be checked against revealed-preference evidence from domain-satisfaction regressions.
The Personal Wellbeing Index, developed by Cummins and colleagues, comes closest among existing instruments to addressing this directly, asking respondents to rate satisfaction across a fixed set of life domains — standard of living, health, achievement, relationships, safety, community connectedness, and future security. It is not obvious, from the published literature, how far this domain set was derived from prior evidence about what people actually value, as opposed to being a reasonable a priori judgement about what probably matters. Domain satisfaction research in the Rojas tradition, discussed above, uses a similar domain list, apparently for similar reasons. Neither, as far as I can establish, was built from a large-scale, cross-culturally representative survey that began by asking people, openly, what they consider important to their happiness before deciding which domains to measure.
There is a genuine practical constraint that argues for caution rather than simply adding an open-ended values question to every survey. Any workable cross-national instrument needs a limited domain list — long enough to be meaningful, short enough to avoid respondent fatigue and survey bloat, the same trade-off that already governs decisions about how many WHR-style explanatory variables to retain. My own inclination, reflecting on the WHR variables, the Rojas and Cummins domain lists, and the broad pattern of what tends to recur across happiness research, is that five domains, echoing Maslow’s hierarchy of needs, would be a defensible starting point: personal safety, health, financial security, personal relationships, and personal development. This is offered as a hypothesis for testing, not a settled taxonomy. The domains that turn out to matter, and the weight people place on each, are themselves empirical questions that a properly designed values survey would need to answer, not assume in advance.
This gap connects directly to the anchoring vignette methodology described earlier. Constructing a valid set of anchoring vignettes requires the survey designer to first specify the life domains and concrete scenarios the vignettes describe, which means anchoring vignette design already implicitly requires an answer to the values question, whether or not it is posed explicitly. Doing the values work first, rather than embedding untested domain assumptions inside vignette construction, would make the anchoring methodology more defensible rather than less. The absence of a declared-values survey is not, therefore, a peripheral gap in the measurement literature. It is close to the root of it: we have spent decades asking the world to rate its life against a “best possible” reference point that we have never asked the world to define.
What This Means for Understanding the Drivers of Happiness
The measurement problems described above bear directly on my original project ambition: understanding the underlying forces that create happiness at a national level, and how to systematically increase it.
The cross-national comparison approach underlying the WHR makes an implicit assumption: that the Cantril ladder scores of different countries measure the same underlying construct, so that differences in scores reflect differences in genuine wellbeing. If that assumption fails — as the evidence suggests it does — then the regression coefficients that purport to identify the drivers of happiness are estimates of what produces reported happiness, not latent happiness. These may be very different things.
Consider the correlation between social support and happiness in the WHR. If countries with strong social networks also have cultural norms that produce higher ERS (Latin America being the clearest example), the correlation between social support and happiness may be partly spurious: both are elevated by the same underlying cultural configuration rather than by any causal relationship between social connection and genuine wellbeing. Similar concerns apply to the freedom variable, where SDRS in authoritarian contexts plausibly inflates both reported freedom satisfaction and reported happiness simultaneously, generating apparent correlations that have no causal content.
The cultural group approach partially addresses this by using external classifications rather than survey responses as explanatory variables. But it cannot escape the fundamental problem: if cultural groups predict response styles, and response styles drive reported happiness, then cultural groups predicting reported happiness is consistent with cultural groups having no effect whatsoever on latent happiness. The finding that culture predicts reported happiness is robust. Whether it predicts genuine happiness is unknown.
Time series analysis within countries, which controls for ERS by design since response styles are relatively stable within cultures over time, offers a cleaner window on within-country dynamics — but is subject to rescaling and, potentially, to external shocks to the aspirational ceiling such as the smartphone effect hypothesised above. The within-country evidence from longitudinal studies and natural experiments, which controls for both ERS and rescaling to a greater degree, is more reliable and does consistently identify social connection, autonomy, and freedom from material insecurity as wellbeing drivers. But this evidence does not easily translate into the national-level cross-cultural policy prescriptions that the WHR is designed to support.
Towards Better Measurement
The problems identified in this essay are real, known in the academic literature, and not yet solved at scale. But they are in principle solvable, and the current moment offers hope.
Prati and Senik report that Gallup has agreed to add a retrospective wellbeing question to future waves of the World Poll — asking respondents to recall and rate their life satisfaction at a prior point in time on the current scale, which allows the rescaling correction to be estimated. If implemented consistently across all surveyed countries, this represents the most important near-term development in happiness measurement methodology. Within a decade of consistent retrospective data collection, it should become possible to construct corrected global happiness series that begin to separate genuine wellbeing trends from aspiration inflation.
The anchoring vignette approach provides a template for addressing the ERS problem. Developing and validating a set of standardised life scenarios for use as calibration anchors in happiness surveys — describing specific, concrete situations spanning the range of human wellbeing — would allow systematic estimation of cross-cultural scale-use differences and correction of the raw scores accordingly. This is technically feasible and methodologically well-understood. What is missing is the institutional will to add the necessary questions to the major cross-national surveys.
Domain satisfaction surveys — asking people separately about their satisfaction with different life areas (income, health, relationships, work, safety, leisure) and about the relative importance they assign to each domain — would address the “best possible life” definition problem more directly. If different cultures weight life domains differently when evaluating their overall lives, as the Latin American evidence suggests, then a composite satisfaction measure incorporating culturally specific weights could be more meaningful than the unanchored global Cantril ladder. Rojas’ work in Latin America has pioneered this approach; extending it to a global representative sample could make a meaningful difference.
None of these methodological improvements is currently in place. The WHR rankings that attract global media attention and are used to benchmark national policy are produced from data that has not been corrected for response style biases or rescaling, and that assumes cross-cultural comparability that has not been validated. This does not mean the rankings are certainly wrong. It means we cannot currently determine how close to correct they are.
Looking Forward, Not Back
The trajectory of this analysis has followed an honest intellectual arc. It began with the ambition to model happiness differently to the WHR framework, to investigate whether cultural heritage and structural variables can outperform survey-based explanatory factors, and to identify what kinds of societies produce the most flourishing. The empirical work achieved the first two of these goals: the cultural group model, using only objective structural variables and no survey data, outperforms the WHR’s six-factor model on a comparable basis and identifies robust patterns in which cultural heritage is a powerful predictor of reported happiness.
But pursuing the question honestly leads to a third destination: the recognition that what we are measuring may not be happiness in any straightforward sense. The Cantril ladder measures reported position on a scale whose endpoints are defined by a shifting, culturally-variable, imagination of what the best and worst possible lives look like. Response style biases systematically distort cross-cultural comparisons in ways that have not been corrected. Rescaling effects systematically distort temporal comparisons in ways that have been theorised but not yet corrected at global scale. The smartphone hypothesis suggests that global, disruptive, changes can shift the aspirational ceiling for billions of people simultaneously, producing apparent happiness trends that are entirely measurement artefacts.
Elsewhere I have argued strongly in defence of the use of the Cantril ladder to measure happiness, and against the dashboard approach advocated by some in the wellbeing policy community. I want to be clear that nothing in this essay changes my position on this: my view remains that for all its faults, the best way to establish if someone is happy is to ask them. The real question here is not whether they are happy, but why or why not.
Unfortunately, the data needed to answer this question does not yet exist in an adequate form. What does exist is a growing toolkit for producing that data: the Prati-Senik retrospective question, the anchoring vignette methodology, the domain satisfaction approach. The research programme that would produce corrected, cross-culturally comparable, rescaling-adjusted happiness data is visible. It is unclear how and when results that can be delivered that confidently support policy.
In the meantime, the most valuable contribution cross-national happiness research can make may be precisely the one this project arrives at by honest accounting: a clear articulation of what we do not know, how the data we have can mislead, and what better data would need to look like. That is not a failure, it is what serious empirical work needs to do to move the frontier.
Footnotes
-
Prati, A., & Senik, C. (2026). Is it possible to raise national happiness? Journal of Public Economics, 257, 105619. ↩
-
Chen, C., Lee, S.-Y. and Stevenson, H.W. (1995) ‘Response Style and Cross-cultural Comparisons of Rating Scales among East Asian and North American Students’, Psychological Science 6(3): 170–5. ↩
-
Note that this population-weighted average Cantril score needs to be calculated across all countries in the dataset, with 2008 population weights held constant to remove the effect of differential population growth between happier and less happy countries, and with corrections for missing data. ↩
-
See for example Tamm, M. V. (2025). Did smartphones break the world as we knew it? arXiv preprint arXiv:2503.07773. ↩